Pricing dashboard
See what’s been happening on the market lately at a glance.

Widgets

What are widgets?
You can think of widgets as the building blocks of your dashboard view. They are essentially mini versions of our reports. Their purpose is to quickly provide you with meaningful pricing insights, without you spending a significant amount of time going into detail.

Setting widgets up
Dashboard widgets can be set up to show data based on the reporting period (eg. yesterday’s or last month’s data), or based on product/URL selection criteria (eg. per brand, category, website, country, etc.).

Choosing widgets
We have numerous widgets available in within Price2Spy. This may seem overwhelming at first, but don’t worry – this just means you have more options at your disposal. Make sure to check out below the description of each widget and get familiar with them!
Complete list of Price2Spy dashboard widgets
Click on any to find out more!
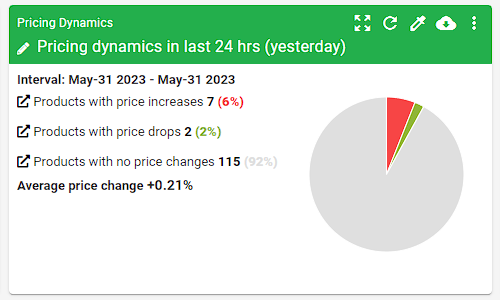
Pricing dynamics
After you select a reporting period (interval) this widget will show you:
- how many products had a price increase;
- how many products had a price drop;
- how many products had no price change in this period;
- overall price change (%).
Most importantly, you will be able to click on any of the numbers in order to see the exact list of products that had a price change.
Stock dynamics
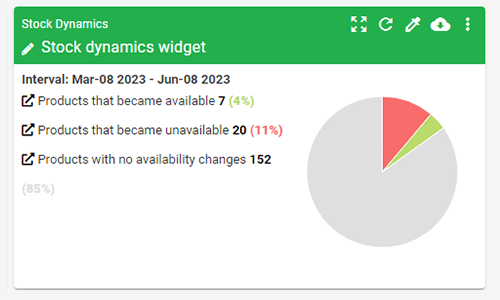
Similar to pricing dynamics – this widget will show a number of products that changed their stock status (availability) during a certain period, such as:
- products that were not available, but got into stock;
- products that ran out of stock;
- products that had no availability change.
Again, you’ll be able to click on any of the numbers, and you’ll see the exact list of products that had a stock change detected.
Pricing landscape
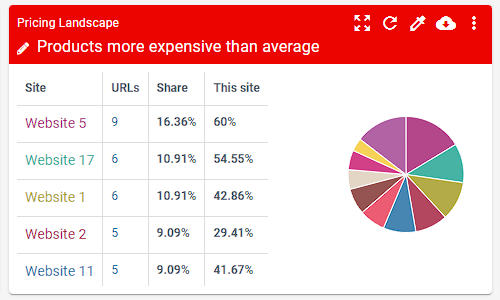
Pricing landscape widget will show you a quick analysis of:
- how many products from monitored sites are the cheapest, the most expensive, or priced below/above/same as your price;
- the number of products that are no longer available, the ones who are violating the targeted price, or the number of products that are priced below/above average;
- the current prices, but in case you are interested to see the prices from a previous date, it can also be done.
Metadata comparison
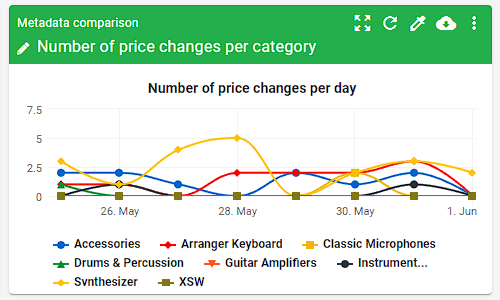
Metadata comparison widget will help you:
- group the results by Brand, Supplier, or Category, and all filtered according to a date range you choose;
- compare and analyze data in an easier way.
Head-to-head comparison
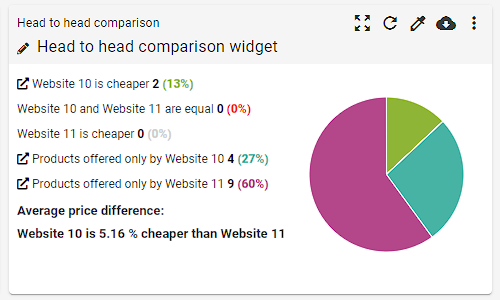
The head-to-head comparison widget enables you to:
- compare 2 competitors’ pricing data independently from your own site;
- discover if the 2 websites are monitoring each other and therefore affecting one another’s pricing strategies;
In order to run a head-to-head comparison all you need to do is specify the following criteria:
- website A;
- website B;
- date range (last 7, 15, 30 days, custom);
- price difference sensitivity (Price2Spy will consider prices are the same if the difference is lower than the selected percentage).
Multiple products from the same site
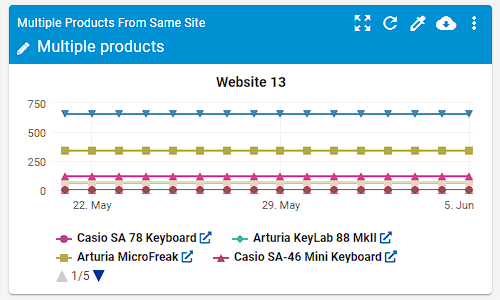
Multiple products from the same site widget will help you identify pricing trends for a group of products on a competitor’s site.
In other words, you’ll see up to 20 products from your selected website.
When doing so, please be sure to use filtering (by product name, category, brand, or supplier) in order to define which products you want to be shown on the chart.
You can also refine the widget by using the charting period (1 week, 1 month, 3 months, etc).
Product history chart
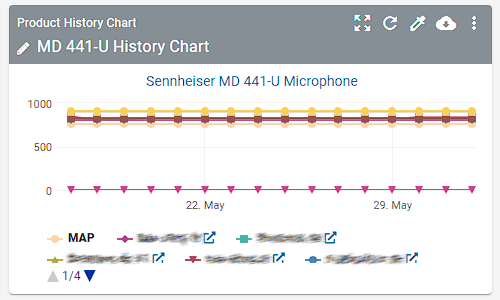
A product history chart will give you a clear picture of product pricing movement across the websites you’re monitoring, and thus help you identify the business logic of your competitors/retailers.
It’s especially useful for monitoring MAP / MSRP violations (MAP price is also shown in the chart – in this case, it’s in orange, so you can clearly see who and when has violated it).
What you need to do is select the desired product, and desired price monitoring period, and possibly filter out sites that will be shown on the chart (using standard site filters).
Please note that the prices from up to 20 sites will be shown on the chart.
Pricing strategy
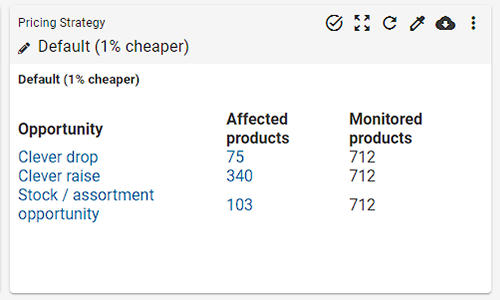
Pricing strategy will help you define your own pricing strategies, which can be segmented either per product category, brand, or supplier (or – for all the products in your Price2Spy account).
There are three default types of repricing opportunities that Price2Spy can help you with:
- Clever Drop – your products are overpriced, so your purchase price and profit margin allow a somewhat lower price;
- Clever Raise – your price is already the lowest on the market, but way too underpriced compared to your next cheaper competitor;
- Stock Opportunities – these are products your competitors do have in stock, and you don’t.
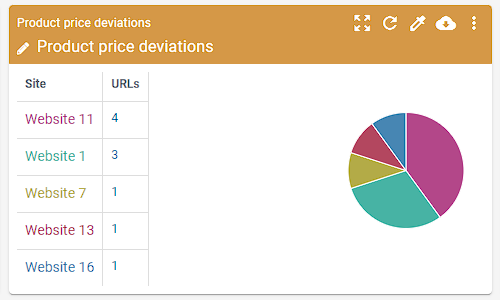
Product price deviations
The product price deviations widget will show you a set of products whose prices deviate from one of the following prices:
- your own price (if defined);
- average price;
- minimal price;
- maximal price;
- price of a specific competitor.
When creating the widget, please make sure you define the price deviation percentage and specify if you’d like to run an analysis only for available/unavailable products (or all products).
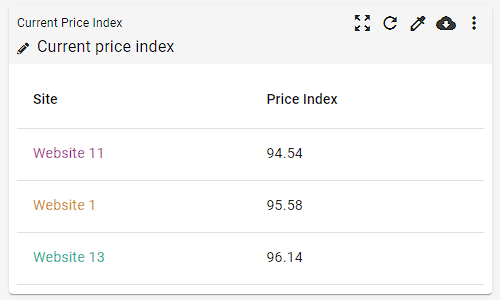
Current price index
Current Price Index is the ratio of a product price from a site and the average price of a product (or some other selected price) multiplied by 100.
For example: if your price is 130, while the average price is 120, your price index is 108.33.
Please note that this widget shows only today’s price index, calculated according to the chosen criteria.
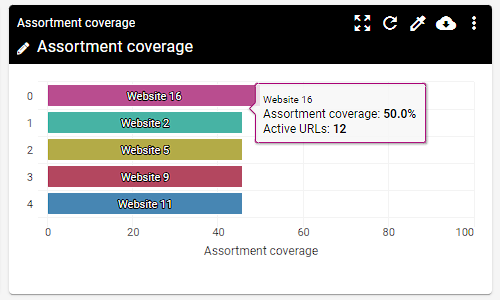
Assortment coverage
Analyze your own and competitors’ percentage of assortment coverage in the most practical way.
By using this widget, you will be able to see the number of active URLs per site.
When you click on the site name you’ll be able to see how many of the products that you’re monitoring a certain site has in the offer.
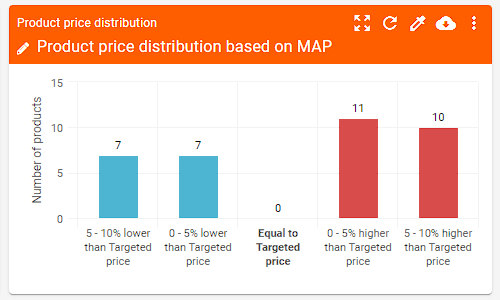
Product price distribution
This widget enables you to:
- analyze your pricing data in comparison to your competitors for a specified range and the selected base price;
- click on any number on the graph and see a preview of the affected products.
Price index
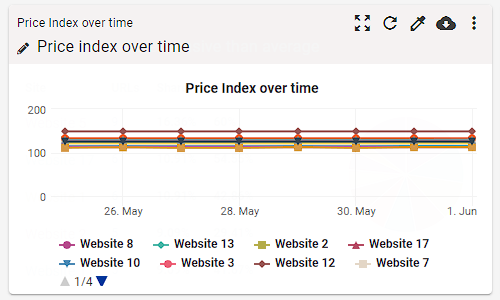
The Price Index widget will show you how the prices from a particular site stand compared to 2 other websites offering the same products.
So, for example, if your product has a price equal to the average price on all websites, then its price index would be 100. If your product is 10% more expensive than the average, your price index would be 110, however, If your product is 5% cheaper than the average, then your price index would be 95.
Product head-to-head comparison
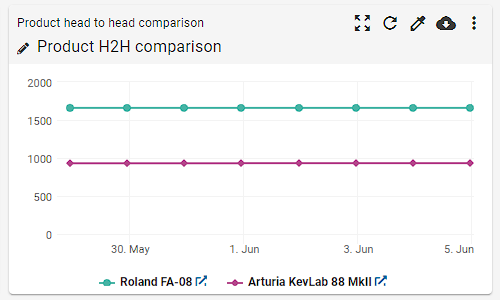
This widget will give you a head-to-head analysis of 2 (or more products) at a quick glance.
To run a Product head-to-head comparison report, all you need to do is select the following criteria according to your needs:
- chart type (Average price per day, Min prices, Max prices, Number of price changes per day, Number of availability changes per day, Number of active URLs);
- date range (last 7, 15, 30 days; last 3 months; custom);
- product A;
- product B.
Price competitiveness
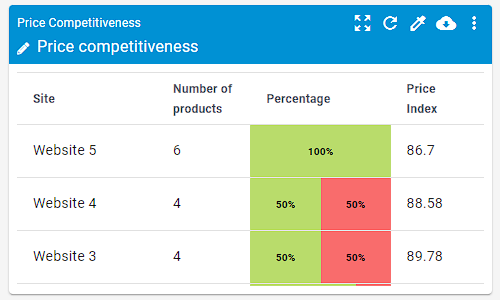
This widget offers an extensive and direct comparison of pricing data from site A against other sites with the same product.
Interested or want to find out more?
That’s great to hear! Start your own free 14-day Price2Spy trial and start creating a dashboard that suits your own needs! Or if you have any questions don’t hesitate to contact us!
