Price2Spy introduces Product price distribution report
Everyone who uses Price2Spy knows that we offer both pricing data acquisition and numerous reporting mechanisms used to analyze that data.
So, in order offer you a new way to analyze your pricing data in different levels – we implemented a new report in our Reports and Dashboard tabs.
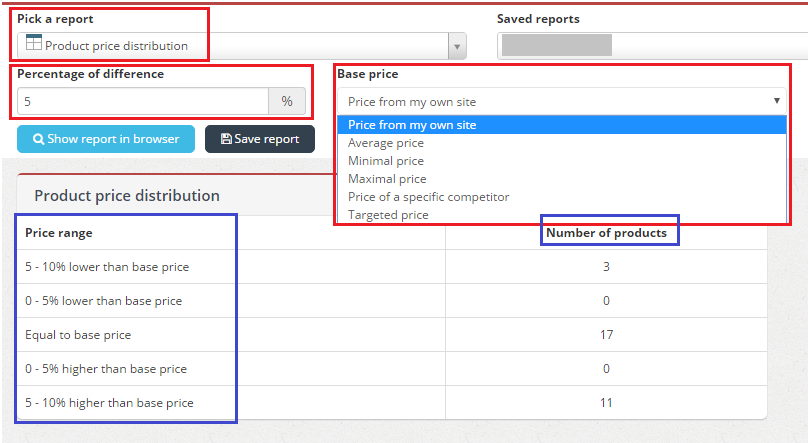
From now on, you can select a Product price distribution report and analyze your pricing data in comparison to your competitors for specified range and the selected base price.
All you need to do is choose the Product price distribution report and respectively:
1) Identify the following criteria:
- Percentage of difference (it’s shown as “5” by default) – please feel free to change it according to your preferences.
2) Select any of the following criteria under Base price: ( it’s shown “Price from my own site” by default) – please also feel free to change it according to your preferences.
- Price from my own site
- Average price
- Minimal price
- Maximal price
- Price of a specific competitor
- Targeted price
Once, you run this report, you’ll receive a list of price ranges and a number of products that are affected by the chosen parameters.
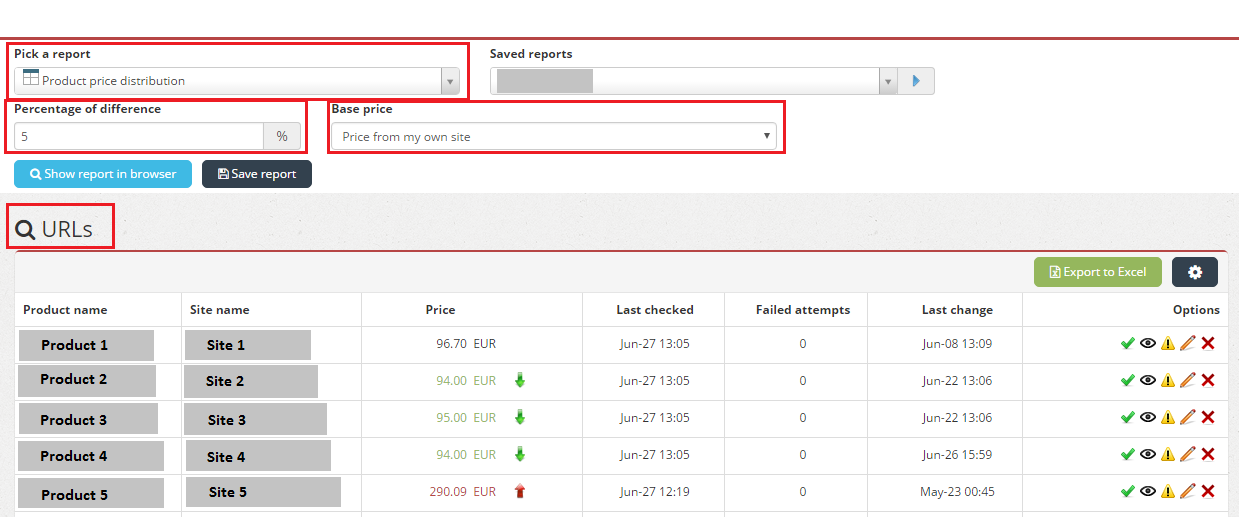
- If you click on any price range on the list, you’ll see a preview of the affected products.
- This report also can be Saved with the selected parameters.
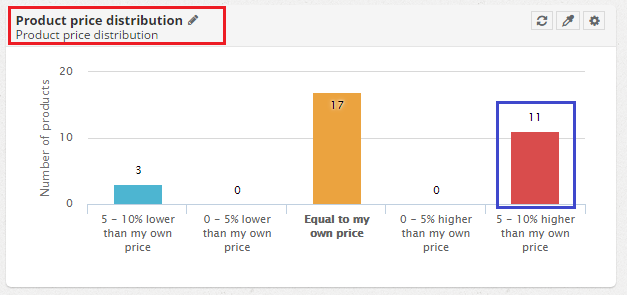
- Additionally, you can create a ‘Product price distribution widget’ according to the same principles on your Dashboard, the logic behind it is identical, but it is more graphical that the report.
- If you click on the number on the graph, you’ll see a preview of the affected products.
Hope you’ll find this report useful in your own analysis 🙂


