New improvements implemented in Product History Chart
Several new improvements have just been implemented for all Price2Spy users in Product history chart.
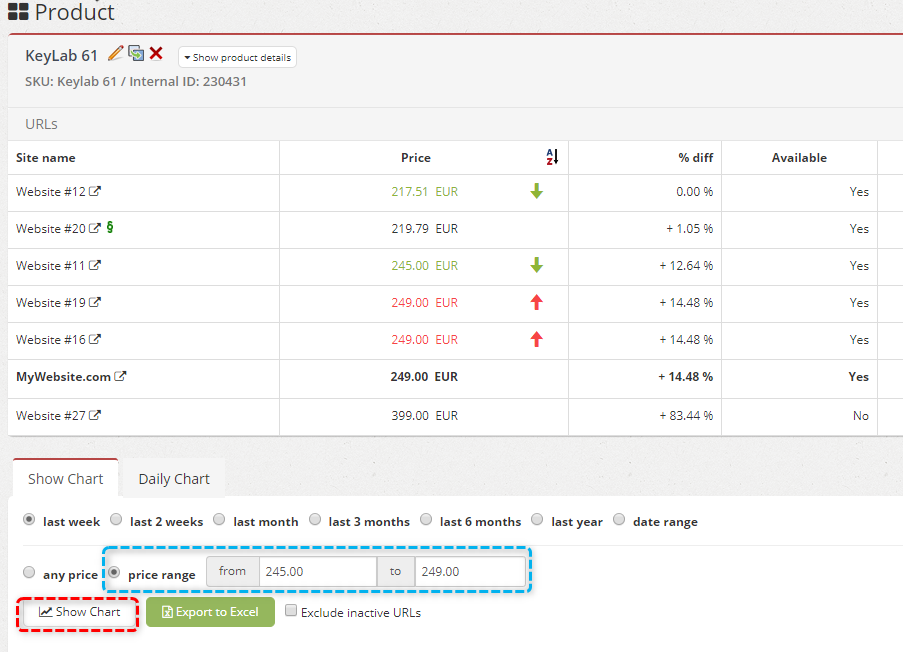
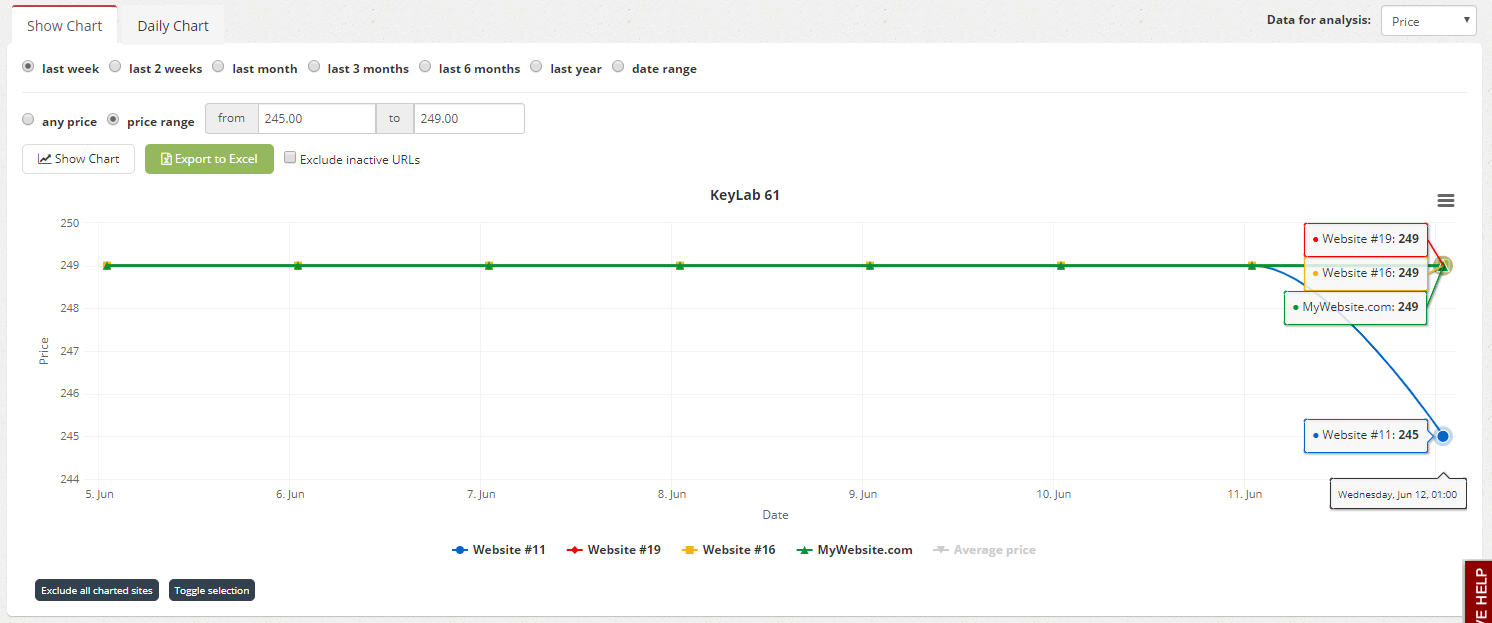
1) New price range filtering option will enable you to decide on the price range that you want to focus on when analyzing the product history chart. It’s a quite handy feature for the ones who want to analyze the specific price range of a single product. It works quite simple;
- Just click the price range, fill in the price range buttons and click on Show Charts.
- Once you run the Product history chart, you’ll get the filtered results where only affected sites will be shown, based on your selections and the price range that you have defined.
2) As you already might know, exporting Product history chart in an Excel format is a possibility we’re offering to our clients for a long time now.
Regarding this, we’ve introduced the following improvements in order for you to further analyze and process the exported data in an easier way:
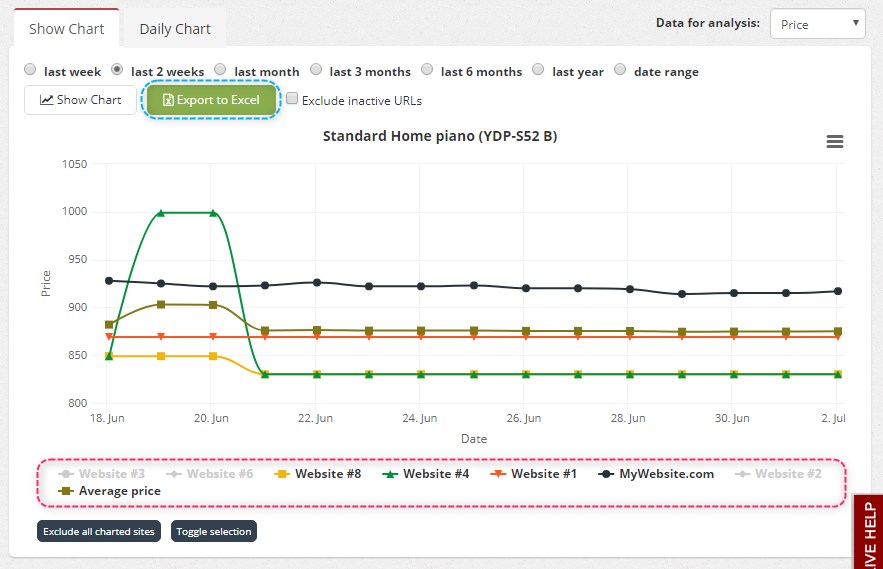
- Only the sites which have been selected on the chart will be exported (deselected sites will not be exported).
- If selected on the chart, the Average price column will be visible in the Excel sheet too.
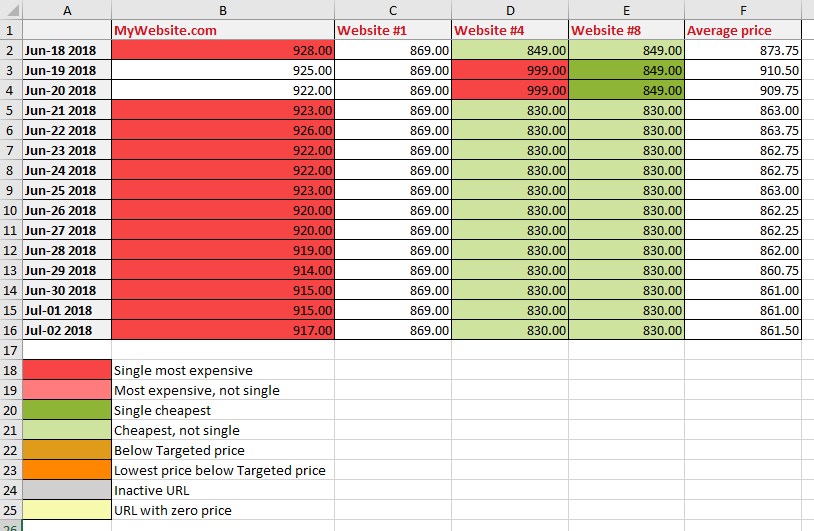
- The exported report will be color coded from now on, and the full-color code will be visible at the bottom of the Excel sheet.
Once exported, the data will be displayed in the Excel sheet according to features / date range / websites that you’ve chosen.
How do you like these new improvements? Feedback is always welcome!


