Introducing Pricing Dashboard
- Reporting period (interval). For example, you can check yesterday’s data, data from last week, or data from last month.
- Based on product / URL selection criteria (per brand / category / site / country and so on)
What we have to offer in this initial phase are the following types of widgets:
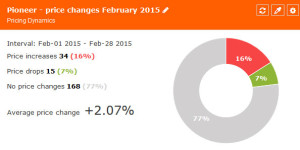
1. Price dynamics widget – it shows price changes for a defined interval. By price changes, there are 2 types (price rises and price drops) and this report shows both of them as well as the number of products with no price changes in this period. Finally, it calculates overall price change average (%) too.
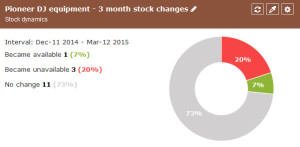
2. Stock dynamics widget – again, similar to Price dynamics widget, but shows the number of products that changed their stock status during the selected period (products that were not available, but got into stock ; products than ran out of stock and finally products that had no availability change):
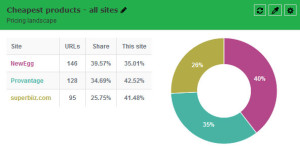
3. Pricing landscape – this report basically gives you a possibility to choose if you would like to see a list of leading sites when it comes to the number of cheapest / most expensive products; a list of leading sites when it comes to the number of products with price below / above your price and so on, e.g:
The above would be the first group of widgets we have released and we will blog about each of them in more details. We are planning to add more widgets to the Dashboard section and of course, we are looking forward to your ideas and suggestions :).


