Changes in the Price change Dynamics report
Price change dynamics is a very useful report that gives you insight into price changes over a period of time – it makes easy to determine days / periods when your competitors change prices the most. However, we believe that improving this chart would make it stand out among other useful reports we offer – so more of our clients would run it!
Let’s see what those changes are.
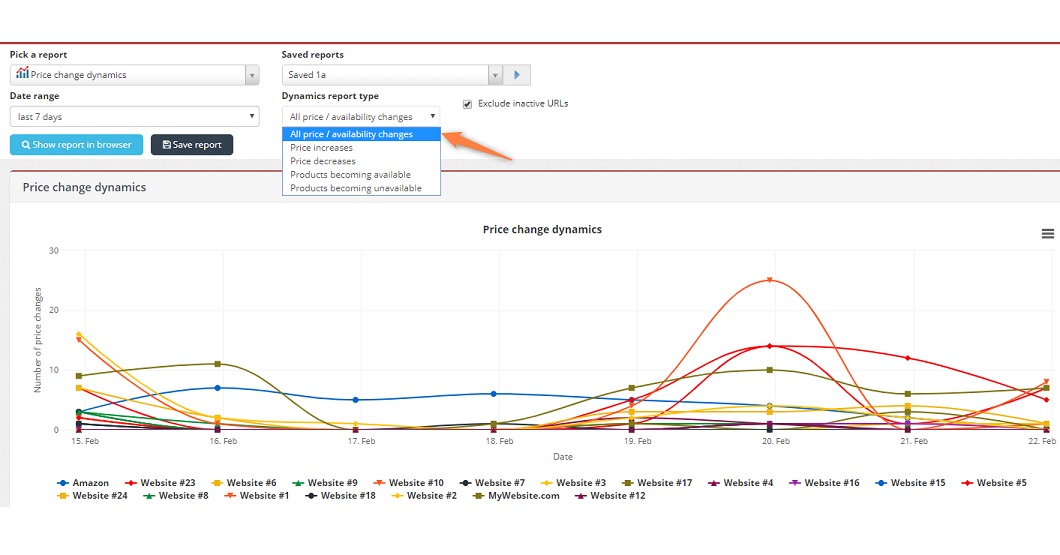
1.All price / availability changes – new option in Dynamics report type
As you already might know, to be able to run Price change dynamics report you need to specify Date range and Dynamics report type.
When it comes to Dynamics report type, so far there were only 4 options available (price increase / decrease and product availability / unavailability) and you needed to choose one of the option among them. Upon a request of our client’s, we have decided to implement one more option; All price / availability changes as a default option.
So, it means that from now on, you can choose newly introduced option to see the all price / availability change dynamics over time.
2. Clickable fields in the Price change dynamics chart
In addition, you will be able to see not only the number of price changes on a desired day, but also on which sites those price changes happened.
Please click on Reports and choose the Price change dynamics report.
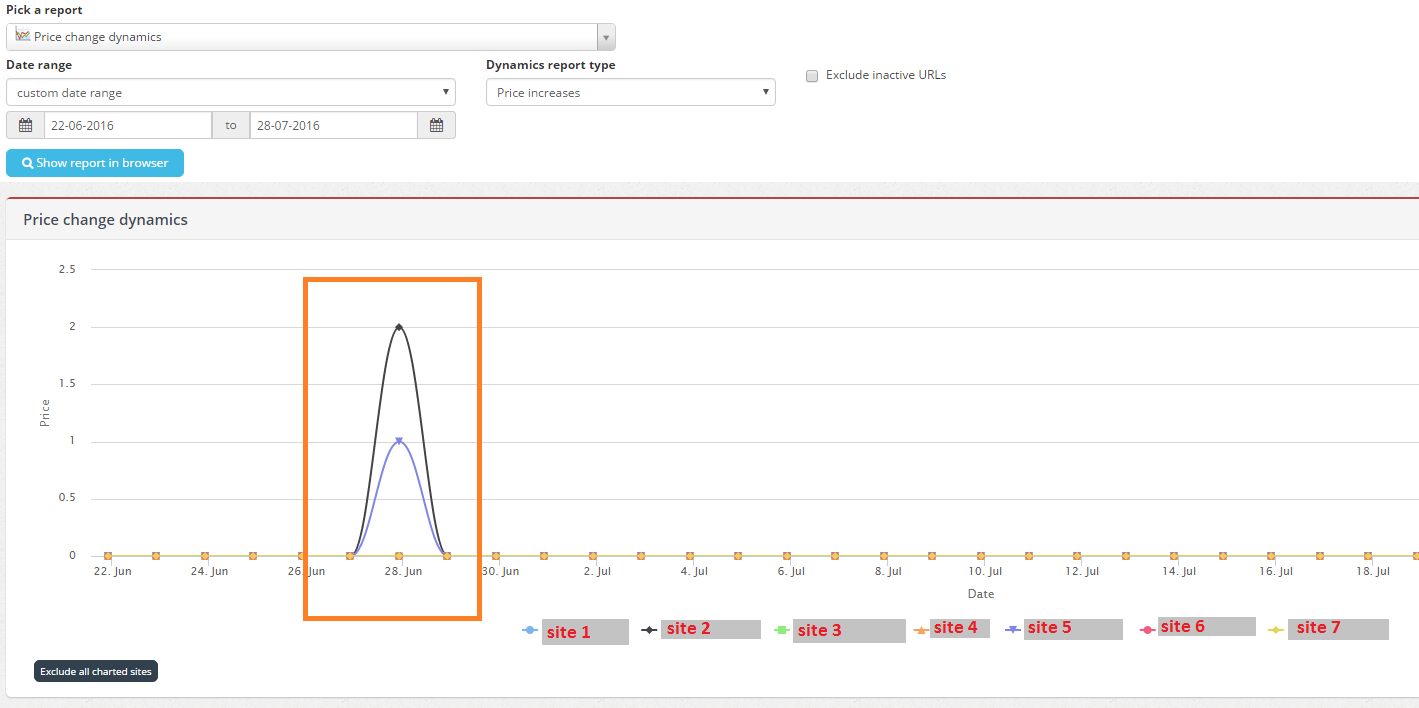
Choose the desired date range (e.g. 5 weeks).
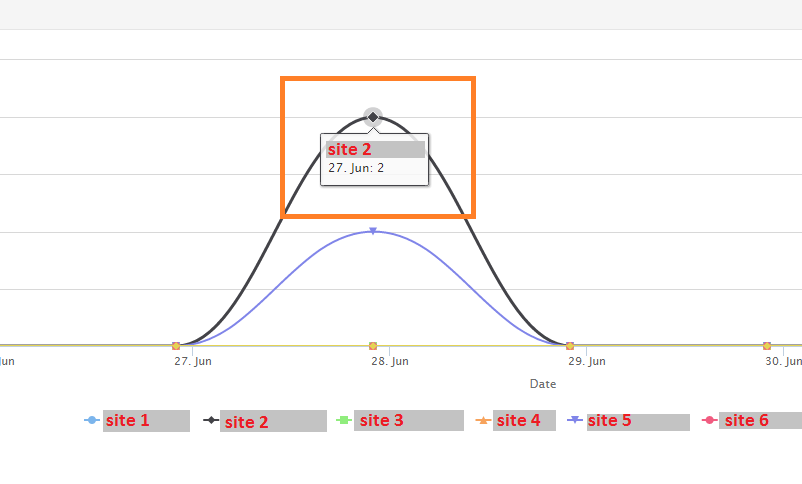
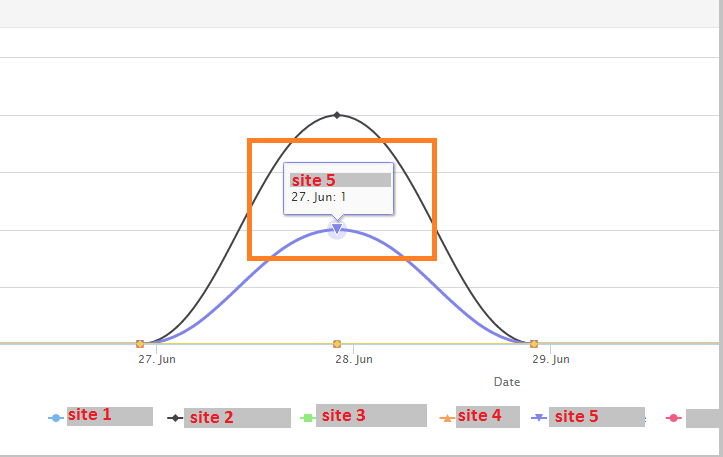
So, there were some price changes on Jun-27 on 2 sites. By hovering over the dots we can see which sites and how many price changes happened.
There were 2 price changes on site 2:
and there was 1 price change on site 5.
Click on the site name and you will get an extended URL view of all price changes on the given date for the given site:
We hope that this addition will enable more detailed insight into price change trends for our clients and hope that more of them will start using this report.
What do you think about this or other our reports? We’d love to hear from you!


