Price2Spy introduces Assortment coverage report
Good news – we’ve implemented a new report in our Reports and Dashboard tabs – in order to provide you a new way to analyze your competitor data.
Henceforth, you can select the Assortment coverage report and analyze your own and competitors’ percentage of assortment coverage in the most practical way.
1) All you need to do is choose the Assortment coverage report and run it.
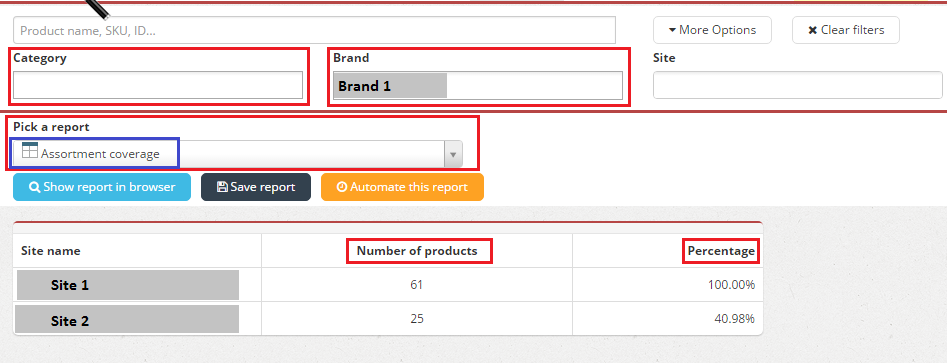
Please bear in mind that you can run this report without applying any criteria but preferably, sorting them according to category / brand will help you to obtain better understanding of the percentage of coverage for the certain product groups. On top of that , you’ll have a chance to analyze your percentage of coverage more effectively in comparison to your competitor(s).
In other words, this report will help you analyze which products you currently have in your account can be found on the monitored websites. Basically you will be able to see the assortment coverage for each website individually.
In the screenshot below, Number of products shows how many products from the total number of products in your account is that particular site offering. For example, 61 products being monitored from Site 1 in your account.
On the other hand, Percentage shows your percentage of coverage – if you monitor products in total, and a site offers 61 products, then the assortment coverage will be displayed as 100%.
You’ll see the details by clicking on the site name – a list of products will appear according to chosen criteria.
Also, this report can be both Saved and Automated.
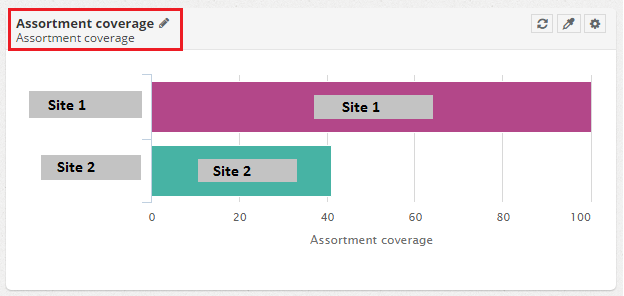
2) You can also create an Assortment coverage widget according to the same principles on your Dashboard, the logic behind it is identical, but it is more graphically displayed.
If you click on the site name, you’ll see a preview of the affected products.
Please let us know if you have any questions or comments, we would be happy to hear from you!


